 Back in December (seems like so long ago), I spent six days with 15,000 brilliant earth and space scientists from around the world who flock annually to San Francisco for the AGU Fall Meeting. I was invited to visually map parts of the conference after I visually facilitated a 10-year strategic planning process for the organization back in October. You can see the murals from both on my Portfolio page.
Because this was the first time AGU had a visual mapper at the conference, they didn’t quite know what to do with me. Aside from the first day, a day-long council meeting in which we reviewed the planning process, I had no idea what I was going to be doing for the next five.
The conference was very scientific. Very. There were sessions titled:
- Exploration and Study of Antarctic Subglacial Aquatic Environments
- Interhemispheric Similarities and Asymmetries in Geospace Phenomena
- Empirical and Modeling Reconstructions of the Tempo, Mode, and Origin of Paleocirculation and Climate Change During the Holocene and Prior Periods
Uh dude, you wouldn’t laugh if you knew my day rate
Being a political science major with an MFA, I was entirely out of my element. (I happened to swing by the Purdue booth–they were there recruiting–to say hi to my alma mater. When I told the guy my major and year I graduated he laughed. I should have told him my day rate. That would have made him stop laughing, but I digress.)
What do you mean I can’t hang paper on the wall?
The day before the conference starts they tell me we can’t hang paper on the wall. Fine. I’ve been doing yoga for 12 years, I know how to be flexible. We can work around that. We’ll just use these big billboard things and have them set up in the rooms I need to be in.
What do you mean I can’t move the billboards to where I need them?
Nope. Once the union guys set them up the day before the conference, they can’t be moved. Um, okay, now what?
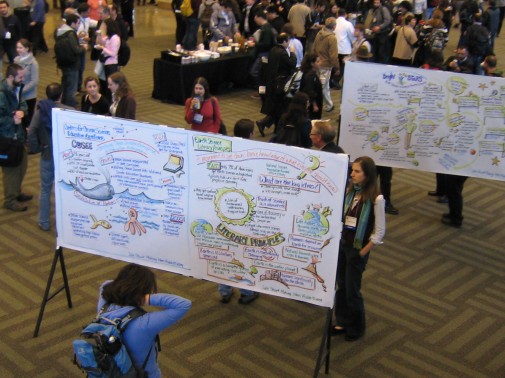
This is me starting to sweat a bit…I was looking at four big, two-sided billboard things set up in the middle of the atrium on the second floor where thousands of people walked by all day and no way for me to do my visual mapping live in the room where I needed to be. Huh?
You mean you want me to do my stuff in the open in front of everyone?
Here I must explain the difference between working live when I’m processing information so quickly that I don’t have time to notice that people are watching me because I’m in a magical flow.
And when I’m not working live and I have time to think about what I’m doing which sounds like this in my head: let’s see I can put the whale here and then put the fish there and then have room to list the objectives. What color goes with that red? No, that doesn’t look good. Crap. I need to erase that wave because it doesn’t look good.
That’s the kind of stuff I NEVER hear when I’m working live. Plus it takes me a lot longer because I think about what I’m doing. So it’s harder for me to get into a rhythm when I’m standing in front of eight feet of white paper and no one is talking.
In which I pull an old skill out of my bag of tricks
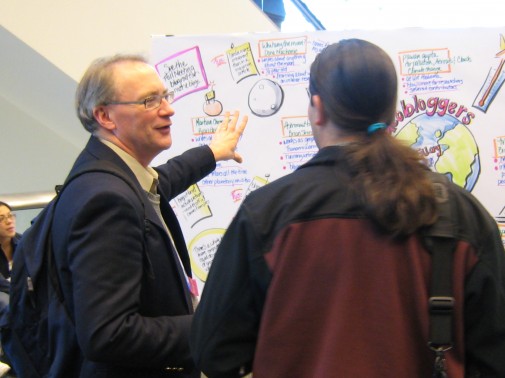
So I resorted to an old skill of mine from when I worked as a journalist: I became a roving reporter. I found interesting sessions to attend like the Geoblogger’s lunch and the Bright STaRS lunch with the smart high school kids, took notes, then conquered my performance anxiety and in front of passersby, started composing the first mural from my notes. It was from a workshop teaching scientists how to talk to Congress. Here’s a piece of it.

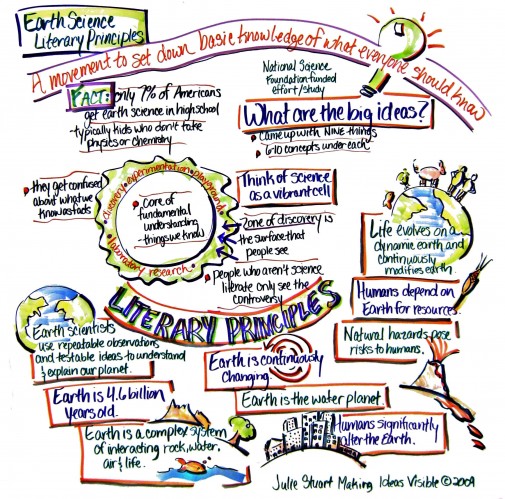
And it turned out great. A little more polished than a live mural because I could take my time with it and be more precise. The roving journalism became my schtick all week. Attend a few sessions, take notes and turn them into murals. I also interviewed some folks who were presenting cool projects and programs and turned those into mini-murals like this one on the movement to set down the basic knowledge of what everyone should know about earth science like the earth is 4.6 billion years old. Take that creationists! 
And being there in the atrium generated a lot of interest. People came by and talked to me while I worked to say they loved what I was doing. I got interviewed for a NASA blog.
Getting the visual maps onto the blogs and Twitter right away
I digitized the murals as soon as I completed them and posted them to Twitter with the #AGU09 hashtag. The AGU staff posted them on the Fall Meeting blog here and here. We disseminated them right away so that people following the conference from all over the world could see a tiny glimpse of what was going on.
People took pictures and blogged about it. When beer o’clock took place in the atrium every afternoon, tons of people gathered around the murals to learn about sessions they missed like How to be a Congressional Science Fellow.

As the week progressed, the remarkableness of visual mapping filled the space in the second floor atrium. It became a place for people to gather and talk, infusing a boring conference space with color, movement and art making it feel more human. More lively.
This was the first time I’ve worked this way–due to constraints with the conference facility that I wasn’t privy to until I was at the conference forcing me to come up with a plan B and quick–and it turned out better than I would have thought. The old saying about turning lemons into lemonade comes to mind. And now I have a new process I feel comfortable with in case there’s another instance where I don’t have walls or billboards that move.
